Synchronize panels by clicking the panel directional buttons found at the top of the panel.
Row of 58
US EPA LCA
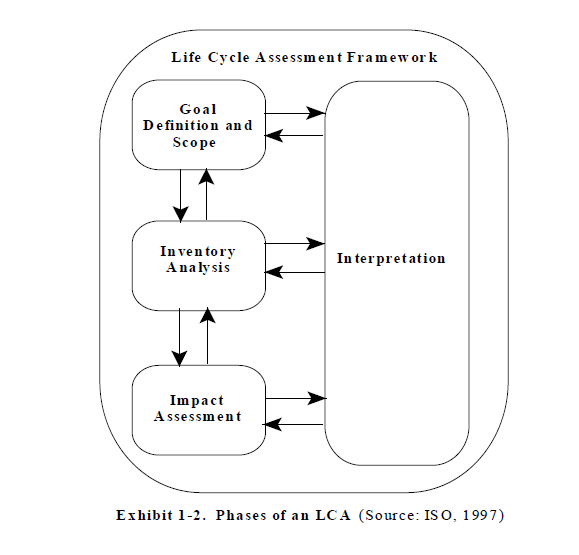
This image derives from a US Environmental Protection Agency publication about Life Cycle Analysis (2006). It shows how to tie images and photos to content. The resource was saved successfully on: 7/17/2014 4:44:48 PM
Video:
Video GreenTreks
This short video is used to demonstrate how to link multimedia to content. The resource was saved successfully on: 9/30/2014 9:46:55 PM
Conventional Orange Environmental Performance
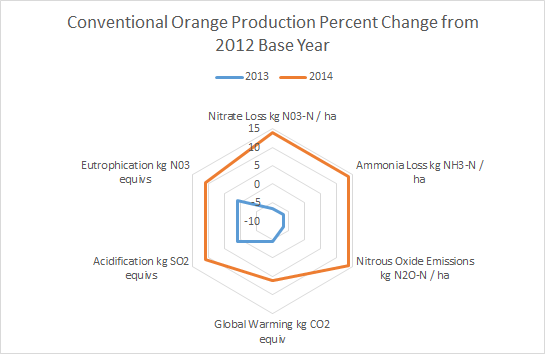
This graph of Brazilian conventional orange production depicts emissions and environmental performance as a percent of a base year or scenario. The data is pro forma and used in tutorials. The resource was saved successfully on: 11/7/2014 1:23:26 AM
Crop Emissions and Environmental Trends
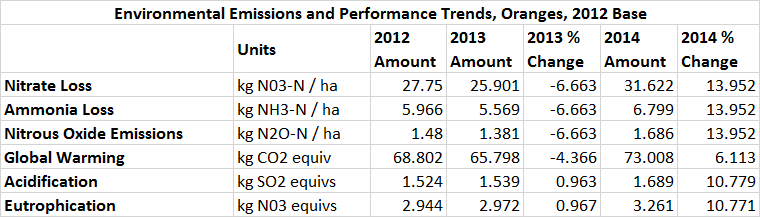
Displays trends in natural resource stocks for agricultural production. The resource was saved successfully on: 11/8/2014 5:54:31 PM
Emissions Dataset, Ex 1
This csv dataset is used in a Resource Stock Calculation tutorial. The resource was saved successfully on: 6/1/2015 6:46:49 PM
P Correlation Matrix Blank
Blank Pearson correlation matrix used in CTA tutorials. The resource was saved successfully on: 2/13/2015 8:19:10 PM
Pearson Price Yield Correlation Matrix
This Pearson correlation matrix is used in the Conservation Technology Assessment tutorial. The resource was saved successfully on: 2/13/2015 8:19:33 PM
S Correlation Matrix Blank
Blank Spearman correlation matrix used in CTA tutorial. The resource was saved successfully on: 2/13/2015 8:20:00 PM
Price and Yield data set
Contains an 11 observation price yield data set used in CTA tutorial. The resource was saved successfully on: 6/2/2015 5:25:44 PM
Spearman Price Yield Correlation Matrix
This Spearman correlation matrix is used in the CTA tutorial. The resource was saved successfully on: 1/9/2015 6:56:54 PM
Simulated Annealing Data Set
This data set is used in a CTA tutorial. The resource was saved successfully on: 6/2/2015 8:39:48 PM
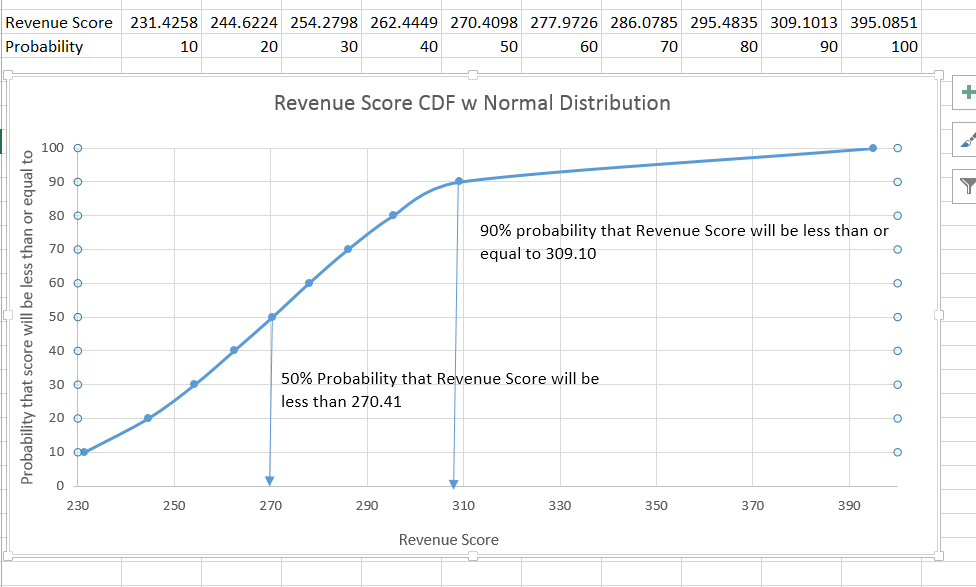
CTA, Example 1 CDF
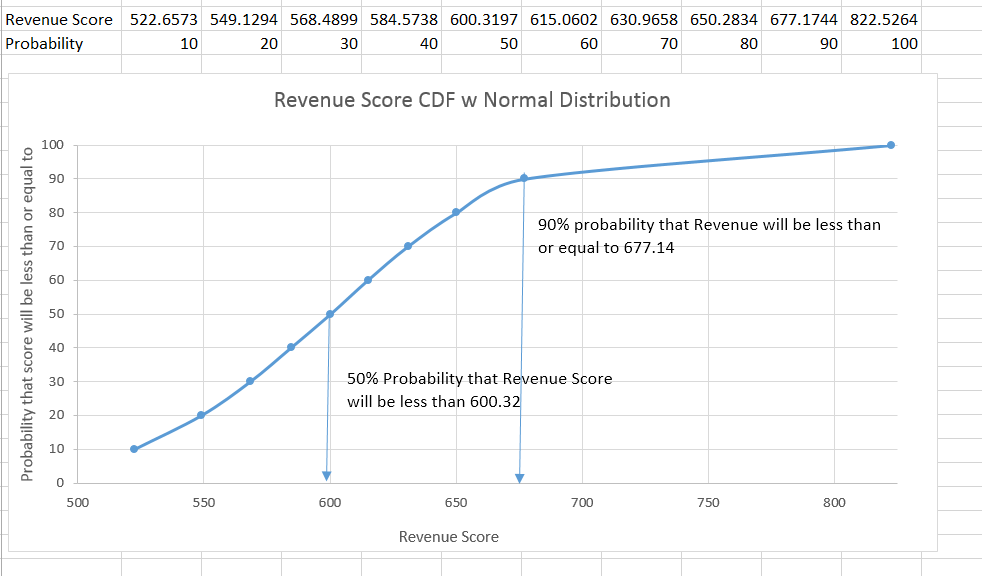
This cumulative density function is used in Example 1 of the CTA reference. The resource was saved successfully on: 6/2/2015 4:33:21 PM
CTA, Example 2 CDF
This cumulative density function is used in Example 2 of the CTA reference. The resource was saved successfully on: 6/2/2015 5:10:16 PM
Energy Use and House Size, Ex 6
Sample dataset used for regression analysis in the CTA tutorial, The resource was saved successfully on: 6/2/2015 6:21:18 PM
Tree Size, Ex 6a
Sample dataset used for regression analysis in the CTA tutorial, The resource was saved successfully on: 3/23/2015 9:58:21 PM
Shipment Cost, Ex 6a
Sample dataset used for regression analysis in the CTA tutorial, The resource was saved successfully on: 6/2/2015 9:46:49 PM
Savings, Ex 6a
Sample dataset used for regression analysis in the CTA tutorial, The resource was saved successfully on: 3/23/2015 9:55:18 PM The resource was saved successfully on: 3/23/2015 9:59:23 PM
Flower Color 5
Sample dataset used for regression analysis in the CTA tutorial, The resource was saved successfully on: 6/2/2015 10:28:20 PM
Flower Color 9
Sample dataset used for regression analysis in the CTA tutorial, The resource was saved successfully on: 6/2/2015 10:29:36 PM
Shipment Cost, Ex 6b
Sample dataset used for regression analysis in the CTA tutorial, The resource was saved successfully on: 3/23/2015 9:56:20 PM
Automobile Price Test data
This dataset is used to predict automobile price using aMachine Learning algorithm. The resource was saved successfully on: 3/16/2015 11:32:50 PM
R Project Test Data 1
This dataset is used in an online test of the R project. The resource was saved successfully on: 3/19/2015 11:15:16 PM
Example 8 R 1
This data set is used for R project tests. The resource was saved successfully on: 3/23/2015 8:03:51 PM
R lm Cloud Script
This script is used in a CTA tutorial. The resource was saved successfully on: 4/27/2015 10:04:48 PM
R lm Web script
This script is used in a CTA tutorial. The resource was saved successfully on: 4/24/2015 9:05:27 PM